
Page 92 - CCL AR 2017 Final
P. 92
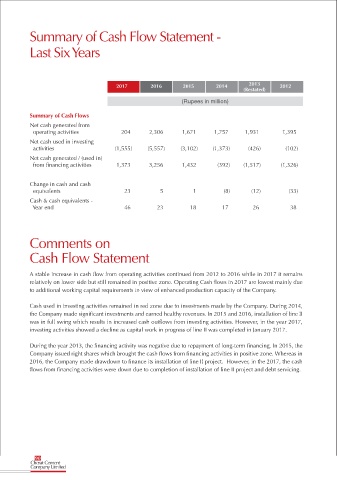
Summary of Cash Flow Statement -


            Last Six Years


                                          2017        2016        2015       2014        2013       2012
                                                                                       (Restated)

                                                                 (Rupees in million)

            Summary of Cash Flows
            Net cash generated from
              operating activities          204       2,306       1,671      1,757      1,931        1,395
            Net cash used in investing
              activities                  (1,555)     (5,557)    (3,102)    (1,373)      (426)        (102)
            Net cash generated / (used in)
              from financing activities    1,373      3,256       1,432       (392)    (1,517)      (1,326)

            Change in cash and cash
              equivalents                    23           5           1         (8)       (12)         (33)

            Cash & cash equivalents -
              Year end                       46          23         18          17         26           38


           Comments on

           Cash Flow Statement


           A stable increase in cash flow from operating activities continued from 2012 to 2016 while in 2017 it remains
           relatively on lower side but still remained in positive zone. Operating Cash flows in 2017 are lowest mainly due
           to additional working capital requirements in view of enhanced production capacity of the Company.


           Cash used in investing activities remained in red zone due to investments made by the Company. During 2014,
           the Company made significant investments and earned healthy revenues. In 2015 and 2016, installation of line II
           was in full swing which results in increased cash outflows from investing activities. However, in the year 2017,
           investing activities showed a decline as capital work in progress of line II was completed in January 2017.

           During the year 2013, the financing activity was negative due to repayment of long-term financing. In 2015, the
           Company issued right shares which brought the cash flows from financing activities in positive zone. Whereas in
           2016, the Company made drawdown to finance its installation of line II project.  However, in the 2017, the cash
           flows from financing activities were down due to completion of installation of line II project and debt servicing.


             90
            Cherat Cement
            Company Limited