
Page 91 - CCL AR 2017 Final
P. 91
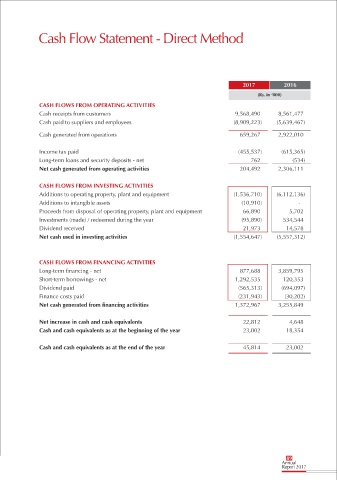
Cash Flow Statement - Direct Method


                                                                                       2017          2016
                                                                                            (Rs. in ‘000)
               CASH FLOWS FROM OPERATING ACTIVITIES
               Cash receipts from customers                                         9,568,490       8,561,477
               Cash paid to suppliers and employees                                 (8,909,223)    (5,639,467)

               Cash generated from operations                                         659,267       2,922,010

               Income tax paid                                                        (455,537)      (615,365)
               Long-term loans and security deposits - net                                762            (534)
               Net cash generated from operating activities                           204,492       2,306,111


               CASH FLOWS FROM INVESTING ACTIVITIES
               Additions to operating property, plant and equipment                 (1,536,710)    (6,112,136)
               Additions to intangible assets                                          (10,910)            -
               Proceeds from disposal of operating property, plant and equipment       66,890           5,702
               Investments (made) / redeemed during the year                           (95,890)      534,544
               Dividend received                                                       21,973         14,578
               Net cash used in investing activities                                (1,554,647)    (5,557,312)


               CASH FLOWS FROM FINANCING ACTIVITIES
               Long-term financing - net                                              877,688       3,859,795
               Short-term borrowings - net                                          1,292,535        120,353
               Dividend paid                                                          (565,313)      (694,097)
               Finance costs paid                                                     (231,943)       (30,202)
               Net cash generated from financing activities                         1,372,967       3,255,849


               Net increase in cash and cash equivalents                               22,812           4,648
               Cash and cash equivalents as at the beginning of the year               23,002         18,354

               Cash and cash equivalents as at the end of the year                     45,814         23,002


                                                                                                      89
                                                                                                    Annual
                                                                                                    Report 2017