
Page 88 - CCL AR 2017 Final
P. 88
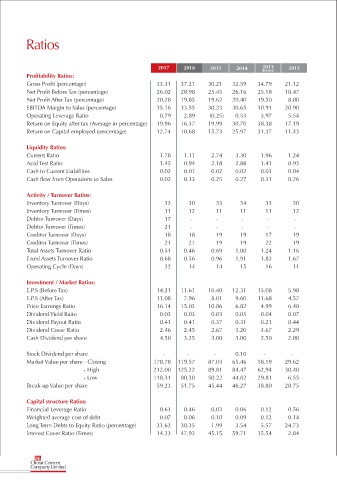
Ratios


                                                         2017     2016     2015     2014      2013     2012
                                                                                             (Restated)
          Profitability Ratios:
          Gross Profit (percentage)                     33.31    37.21     30.21    32.59     34.79     21.12
          Net Profit Before Tax (percentage)            26.02    28.98     25.45    26.16     25.18     10.47
          Net Profit After Tax (percentage)             20.28    19.85     19.62    20.40     19.50     8.00
          EBITDA Margin to Sales (percentage)           35.16    33.55     30.23    30.65     30.91     20.90
          Operating Leverage Ratio                       0.79     2.89     (0.25)    0.53     5.97     5.54
          Return on Equity after tax (Average in percentage)    19.96    16.37     19.99    30.70     38.38     17.19
          Return on Capital employed (percentage)       12.74    10.68     15.73    25.97     31.37     11.43


          Liquidity Ratios:
          Current Ratio                                   1.78     1.11     2.74     3.30     1.96     1.24
          Acid Test Ratio                                1.45     0.94      2.18     2.88     1.41     0.93
          Cash to Current Liabilities                     0.02     0.01     0.02     0.02     0.03     0.04
          Cash flow from Operations to Sales              0.02     0.33     0.25     0.27     0.31     0.26

          Activity / Turnover Ratios:
          Inventory Turnover (Days)                         33      30        33      34       33        30
          Inventory Turnover (Times)                        11      12        11      11       11        12
          Debtor Turnover (Days)                            17      -        -         -       -         -
          Debtor Turnover (Times)                           21      -         -        -        -        -
          Creditor Turnover (Days)                          18      18        19      19       17        19
          Creditor Turnover (Times)                         21      21        19      19       22        19
          Total Assets Turnover Ratio                     0.51     0.46     0.69     1.00     1.24     1.16
          Fixed Assets Turnover Ratio                     0.68     0.56     0.96     1.91     1.83     1.67
          Operating Cycle (Days)                            32      14        14      15       16        11


          Investment / Market Ratios:
          E.P.S (Before Tax)                             14.21    11.61     10.40    12.31     15.08     5.98
          E.P.S (After Tax)                             11.08     7.96      8.01     9.60     11.68     4.57
          Price Earnings Ratio                           16.14    15.03     10.86     6.82     4.99     6.48
          Dividend Yield Ratio                            0.03     0.03     0.03     0.05     0.04     0.07
          Dividend Payout Ratio                           0.41     0.41     0.37     0.31     0.21     0.44
          Dividend Cover Ratio                            2.46     2.45     2.67     3.20     4.67     2.29
          Cash Dividend per share                         4.50     3.25     3.00     3.00     2.50     2.00

          Stock Dividend per share                         -        -        -        0.10     -        -
          Market Value per share - Closing              178.78    119.57     87.03    65.46     58.19     29.62
                               - High                   212.00    125.22     89.81    84.47     62.94     30.40
                               - Low                    118.31    80.30     50.22    44.82     29.81     6.55
          Break-up Value per share                       59.23    51.75     45.44    46.27     38.80     28.75


          Capital structure Ratios:
          Financial Leverage Ratio                        0.61     0.46     0.03     0.06     0.12     0.56
          Weighted average cost of debt                  0.07     0.06      0.10     0.09     0.12     0.14
          Long Term Debts to Equity Ratio (percentage)       31.63    30.35     1.99     3.54     5.57     24.73
          Interest Cover Ratio (Times)                   14.33    47.93     45.15    59.71     15.54     2.84


             86
            Cherat Cement
            Company Limited