
Page 94 - CCL AR 2017 Final
P. 94
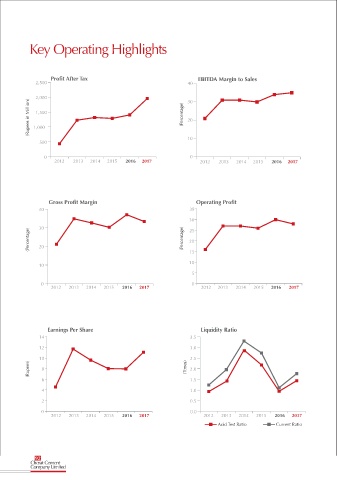
Key Operating Highlights


                   Profit After Tax                                    EBITDA Margin to Sales
              2,500                                                40

              2,000                                                30
           (Rupees in Million)  1,000                             (Percentage)  20
              1,500


                                                                   10
               500

                 0                                                  0
                    2012   2013  2014  2015  2016  2017                 2012  2013  2014  2015   2016  2017


                  Gross Profit Margin                                 Operating Profit
               40                                                   35
                                                                    30
               30                                                   25
           (Percentage)  20                                       (Percentage)  20


                                                                    15
                                                                    10
               10
                                                                     5
                0                                                    0
                   2012  2013  2014   2015  2016  2017                  2012  2013  2014  2015   2016  2017


                  Earnings Per Share                                    Liquidity Ratio
               14                                                   3.5
               12                                                   3.0
               10
           (Rupees)  8                                             (Times) 2.5
                                                                    2.0
                6                                                   1.5
                4                                                   1.0

                2                                                   0.5
                0                                                   0.0
                   2012  2013  2014   2015  2016  2017                   2012  2013  2014  2015   2016  2017
                                                                              Acid Test Ratio     Current Ratio


             92
            Cherat Cement
            Company Limited