
Page 97 - CCL AR 2017 Final
P. 97
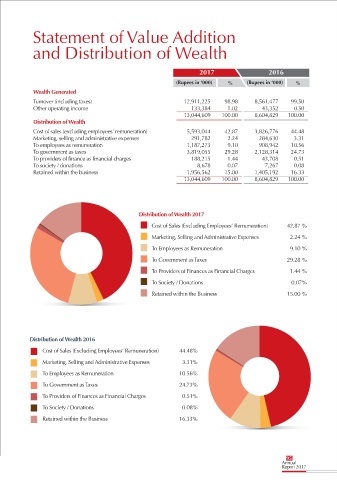
Statement of Value Addition


             and Distribution of Wealth


                                                                       2017                     2016

                                                               (Rupees in ‘000)  %      (Rupees in ‘000)  %
             Wealth Generated
             Turnover (including taxes)                           12,911,225     98.98     8,561,477     99.50
             Other operating income                                  133,384      1.02        43,352     0.50
                                                                  13,044,609     100.00     8,604,829    100.00
             Distribution of Wealth
             Cost of sales (excluding employees' remuneration)     5,593,044     42.87     3,826,776     44.48
             Marketing, selling and administrative expenses          291,782      2.24       284,630     3.31
             To employees as remuneration                          1,187,273      9.10       908,942     10.56
             To government as taxes                                3,819,055     29.28     2,128,314     24.73
             To providers of finance as financial charges            188,215      1.44        43,708     0.51
             To society / donations                                    8,678      0.07         7,267     0.08
             Retained within the business                          1,956,562     15.00     1,405,192     16.33
                                                                  13,044,609     100.00     8,604,829    100.00


                                                  Distribution of Wealth 2017

                                                       Cost of Sales (Excluding Employees’ Remuneration)     42.87 %

                                                       Marketing, Selling and Administrative Expenses    2.24 %
                                                       To Employees as Remuneration                     9.10 %
                                                       To Government as Taxes                         29.28 %

                                                       To Providers of Finances as Financial Charges   1.44 %

                                                       To Society / Donations                           0.07%
                                                       Retained within the Business                    15.00 %


            Distribution of Wealth 2016
                Cost of Sales (Excluding Employees’ Remuneration)    44.48%

                Marketing, Selling and Administrative Expenses    3.31%

                To Employees as Remuneration                    10.56%
                To Government as Taxes                          24.73%
                To Providers of Finances as Financial Charges     0.51%

                To Society / Donations                           0.08%

                Retained within the Business                    16.33%


                                                                                                      95
                                                                                                    Annual
                                                                                                    Report 2017