
Page 96 - CCL AR 2017 Final
P. 96
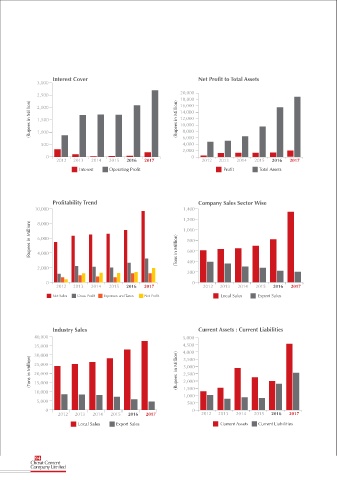
Interest Cover                                     Net Profit to Total Assets
              3,000
                                                                 20,000
              2,500                                              16,000
            (Rupees in Million)  2,000                         (Rupees in Million) 18,000
                                                                 14,000
                                                                 12,000
              1,500
                                                                 10,000
                                                                 8,000
              1,000
                                                                 4,000
               500                                               6,000
                                                                 2,000
                 0                                                   0
                     2012  2013  2014   2015  2016  2017                2012  2013  2014   2015  2016  2017
                             Interest   Operating Profit                        Profit      Total Assets


                    Profitability Trend                                Company Sales Sector Wise
             10,000                                               1,400
                                                                  1,200
              8,000
            (Rupees in Million)  6,000                         (Tons in Million)  1,000
                                                                   800

                                                                   600
              4,000
              2,000                                                400
                                                                   200

                 0                                                   0
                     2012  2013  2014  2015   2016  2017                 2012  2013  2014  2015  2016   2017
                    Net Sales  Gross Profit  Expenses and Taxes  Net Profit    Local Sales  Export Sales


                    Industry Sales                                     Current Assets : Current Liabilities
             40,000                                               5,000
             35,000                                               4,500
                                                                  4,000
            (Tons in Million) 30,000                           (Rupees  in Million)  3,500
             25,000
                                                                  3,000
             20,000
                                                                  2,500
             15,000
                                                                  1,500
             10,000                                               2,000
                                                                  1,000
              5,000                                                500
                 0                                                   0
                     2012  2013   2014  2015  2016  2017                2012  2013  2014   2015  2016  2017
                             Local Sales  Export Sales                         Current Assets  Current Liabilities


             94
            Cherat Cement
            Company Limited