
Page 90 - CCL AR 2017 Final
P. 90
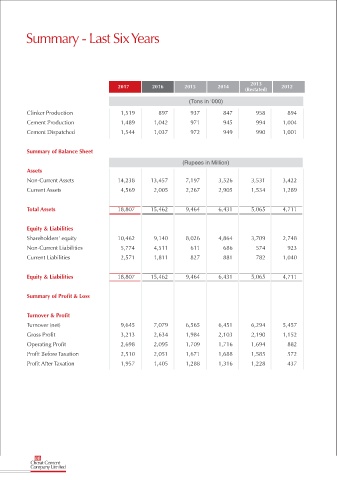
Summary - Last Six Years


                                                                                         2013
                                           2017        2016       2015        2014                  2012
                                                                                       (Restated)
                                                                    (Tons in ‘000)
           Clinker Production               1,519        897         937        847         958        894
           Cement Production                1,489       1,042        971        945         994      1,004
           Cement Dispatched                1,544       1,037        972        949         990      1,001


           Summary of Balance Sheet
                                                                 (Rupees in Million)
           Assets
           Non-Current Assets              14,238      13,457      7,197       3,526      3,531      3,422
           Current Assets                   4,569       2,005      2,267       2,905      1,534      1,289

           Total Assets                    18,807      15,462      9,464       6,431      5,065      4,711


           Equity & Liabilities
           Shareholders' equity            10,462       9,140      8,026       4,864      3,709      2,748
           Non-Current Liabilities          5,774       4,511        611        686         574        923
           Current Liabilities              2,571       1,811        827        881         782      1,040

           Equity & Liabilities            18,807      15,462      9,464       6,431      5,065      4,711

           Summary of Profit & Loss


           Turnover & Profit
           Turnover (net)                   9,645       7,079      6,565       6,451      6,294      5,457
           Gross Profit                     3,213       2,634      1,984       2,103      2,190      1,152
           Operating Profit                 2,698       2,095      1,709       1,716      1,694        882
           Profit Before Taxation           2,510       2,051      1,671       1,688      1,585        572
           Profit After Taxation            1,957       1,405      1,288       1,316      1,228        437


             88
            Cherat Cement
            Company Limited