
Page 83 - CCL AR 2017 Final
P. 83
2015 2014 2013 (Restated) 2012
(Rupees 15 Vs. 14 (Rupees 14 Vs. 13 (Rupees 13 Vs. 12 (Rupees 12 Vs. 11
in Million) % in Million) % in Million) % in Million) %
Balance Sheet
Assets
Non-Current Assets 14,238 6 13,457 87 7,197 104 3,526 - 3,531 3 3,422 (6)
Current Assets 4,569 128 2,005 (12) 2,267 (22) 2,905 89 1,534 19 1,289 (25)
Total Assets 18,807 22 15,462 63 9,464 47 6,431 27 5,065 8 4,711 (12)
Equity & Liabilities
Shareholders' Equity 10,462 14 9,140 14 8,026 65 4,864 31 3,709 35 2,748 18
Non-Current Liabilities 5,774 28 4,511 638 611 (11) 686 20 574 (38) 923 (25)
Current Liabilities 2,571 42 1,811 119 827 (6) 881 13 782 (25) 1,040 (42)
Equity & Liabilities 18,807 22 15,462 63 9,464 47 6,431 27 5,065 8 4,711 (12)
Turnover & Profit
Turnover - net 9,645 36 7,079 8 6,565 2 6,451 2 6,294 15 5,457 29
Gross Profit 3,213 22 2,634 33 1,984 (6) 2,103 (4) 2,190 90 1,152 103
Operating Profit 2,698 29 2,095 23 1,709 - 1,716 1 1,694 92 882 158
Profit Before Taxation 2,510 22 2,051 23 1,671 (1) 1,688 7 1,585 177 572 936
Net Profit for the Year 1,957 39 1,405 9 1,288 (2) 1,316 7 1,228 180 437 537
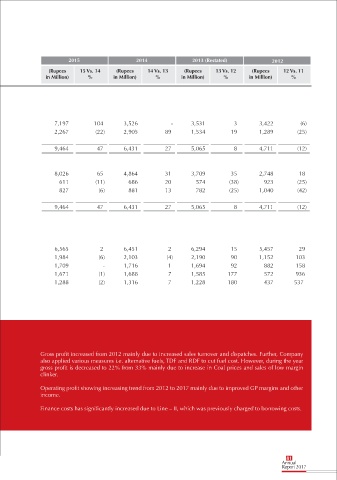
Gross profit increased from 2012 mainly due to increased sales turnover and dispatches. Further, Company
also applied various measures i.e. alternative fuels, TDF and RDF to cut fuel cost. However, during the year
gross profit is decreased to 22% from 33% mainly due to increase in Coal prices and sales of low margin
clinker.
Operating profit showing increasing trend from 2012 to 2017 mainly due to improved GP margins and other
income.
Finance costs has significantly increased due to Line – II, which was previously charged to borrowing costs.
81
Annual
Report 2017