
Page 84 - CCL AR 2017 Final
P. 84
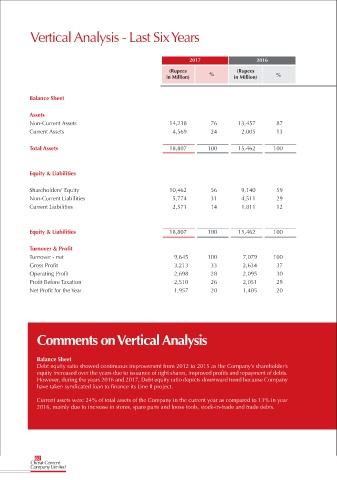
Vertical Analysis - Last Six Years


                                                                    2017                   2016
                                                             (Rupees                 (Rupees
                                                            in Million)    %        in Million)   %


           Balance Sheet

           Assets
           Non-Current Assets                                14,238        76        13,457        87                                   7,197         76         3,526        55        3,531          70        3,422        73
           Current Assets                                     4,569        24          2,005       13                                   2,267         24         2,905        45        1,534          30        1,289        27


           Total Assets                                      18,807       100        15,462      100                                    9,464        100         6,431       100        5,065         100        4,711       100


           Equity & Liabilities

           Shareholders’ Equity                              10,462        56          9,140       59                                   8,026         85         4,864        75        3,709          73        2,748        58
           Non-Current Liabilities                            5,774        31          4,511       29                                     611           6          686        11          574          11          923        20
           Current Liabilities                                2,571        14          1,811       12                                     827           9          881        14          782          16        1,040        22


           Equity & Liabilities                              18,807       100        15,462      100                                    9,464        100         6,431       100        5,065         100        4,711       100


           Turnover & Profit
           Turnover - net                                     9,645       100          7,079     100                                    6,565        100         6,451       100        6,294        100         5,457      100
           Gross Profit                                       3,213        33          2,634       37                                   1,984         30         2,103        33        2,190          35        1,152       21
           Operating Profit                                   2,698        28          2,095       30                                   1,709         26         1,716        27        1,694          27          882       16
           Profit Before Taxation                             2,510        26          2,051       29                                   1,671         25         1,688        26        1,585          25          572       10
           Net Profit for the Year                            1,957        20          1,405       20                                   1,288         19         1,316        20        1,228          20          437        8


              Comments on Vertical Analysis


              Balance Sheet                                                                                                        Profit and Loss Account
              Debt equity ratio showed continuous improvement from 2012 to 2015 as the Company’s shareholder’s                     Gross profit increased from 21% to 33% from years 2012 to 2017 mainly due to increased sales turnover.
              equity increased over the years due to issuance of right shares, improved profits and repayment of debts.            Operating profit was 16% of turnover in year 2012 which has increased to 28% in year 2017 mainly due
              However, during the years 2016 and 2017, Debt equity ratio depicts downward trend because Company                    to improved gross profit margin.
              have taken syndicated loan to finance its Line II project.

              Current assets were 24% of total assets of the Company in the current year as compared to 13% in year
              2016, mainly due to increase in stores, spare parts and loose tools, stock-in-trade and trade debts.


             82
            Cherat Cement
            Company Limited