
Page 126 - CCL AR 2017 Final
P. 126
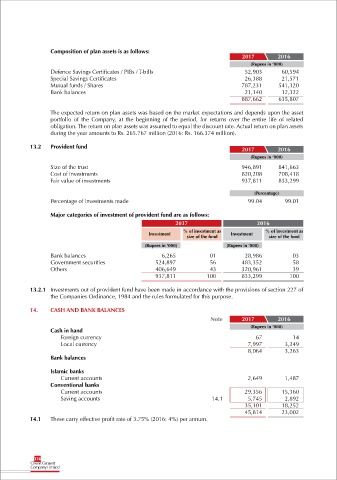
Composition of plan assets is as follows:
                                                                                      2017         2016
                                                                                         (Rupees in ‘000)
                   Defence Savings Certificates / PIBs / T-bills                       52,903       60,594
                   Special Savings Certificates                                        26,388       21,571
                   Mutual funds / Shares                                              787,231      541,320
                   Bank balances                                                       21,140       12,322
                                                                                      887,662      635,807

                   The expected return on plan assets was based on the market expectations and depends upon the asset
                   portfolio  of  the  Company,  at  the  beginning  of  the  period,  for  returns  over  the  entire  life  of  related
                   obligation. The return on plan assets was assumed to equal the discount rate. Actual return on plan assets
                   during the year amounts to Rs. 265.767 million (2016: Rs. 166.374 million).

            13.2   Provident fund                                                     2017         2016

                                                                                         (Rupees in ‘000)
                   Size of the trust                                                  946,891      841,663
                   Cost of investments                                                820,208      708,418
                   Fair value of investments                                          937,811      833,299

                                                                                           (Percentage)
                   Percentage of investments made                                       99.04         99.01

                   Major categories of investment of provident fund are as follows:
                                                               2017                         2016
                                                                  % of investment as           % of investment as
                                                     Investment    size of the fund  Investment  size of the fund

                                                    (Rupees in ‘000)             (Rupees in ‘000)
                   Bank balances                          6,265            01          28,986           03
                   Government securities                524,897            56         483,352           58
                   Others                               406,649            43         320,961           39
                                                        937,811           100         833,299          100

            13.2.1  Investments out of provident fund have been made in accordance with the provisions of section 227 of
                   the Companies Ordinance, 1984 and the rules formulated for this purpose.

            14.    CASH AND BANK BALANCES
                                                                           Note       2017         2016
                                                                                         (Rupees in ‘000)
                   Cash in hand
                       Foreign currency                                                    67           14
                        Local currency                                                  7,997        3,249
                                                                                        8,064        3,263
                   Bank balances

                   Islamic banks
                       Current accounts                                                 2,649        1,487
                   Conventional banks
                       Current accounts                                                29,356       15,360
                       Saving accounts                                      14.1        5,745        2,892
                                                                                       35,101       18,252
                                                                                       45,814       23,002
            14.1      These carry effective profit rate of 3.75% (2016: 4%) per annum.


             124