
Page 82 - CCL AR 2017 Final
P. 82
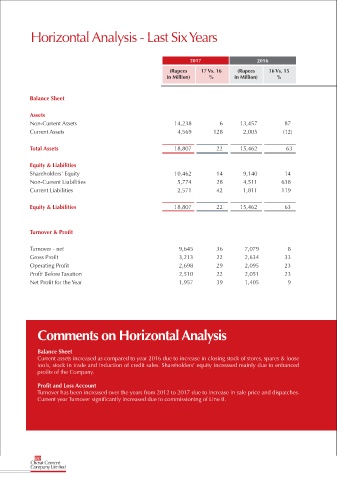
Horizontal Analysis - Last Six Years


                                                                    2017                    2016
                                                             (Rupees    17 Vs. 16    (Rupees    16 Vs. 15
                                                            in Million)    %        in Million)    %


            Balance Sheet

            Assets
            Non-Current Assets                                 14,238          6      13,457         87                                    7,197         104        3,526           -       3,531         3         3,422         (6)
            Current Assets                                      4,569       128        2,005         (12)                                  2,267         (22)       2,905         89        1,534        19         1,289        (25)

            Total Assets                                       18,807        22       15,462          63                                   9,464          47        6,431         27        5,065         8         4,711        (12)

            Equity & Liabilities
            Shareholders' Equity                               10,462        14        9,140         14                                    8,026          65        4,864         31        3,709        35         2,748        18
            Non-Current Liabilities                             5,774        28        4,511        638                                      611         (11)         686         20         574         (38)        923         (25)
            Current Liabilities                                 2,571        42        1,811        119                                      827           (6)        881         13         782         (25)       1,040        (42)

            Equity & Liabilities                               18,807        22       15,462         63                                    9,464          47        6,431         27        5,065         8         4,711        (12)


            Turnover & Profit

            Turnover - net                                      9,645        36        7,079           8                                   6,565           2        6,451          2        6,294        15         5,457        29
            Gross Profit                                        3,213        22        2,634         33                                    1,984           (6)      2,103          (4)      2,190        90         1,152       103
            Operating Profit                                    2,698        29        2,095         23                                    1,709            -       1,716          1        1,694        92          882        158
            Profit Before Taxation                              2,510        22        2,051         23                                    1,671           (1)      1,688          7        1,585       177          572        936
            Net Profit for the Year                             1,957        39        1,405           9                                   1,288           (2)      1,316          7        1,228       180          437        537


              Comments on Horizontal Analysis


              Balance Sheet
              Current assets increased as compared to year 2016 due to increase in closing stock of stores, spares & loose
              tools, stock in trade and induction of credit sales. Shareholders’ equity increased mainly due to enhanced
              profits of the Company.

              Profit and Loss Account
              Turnover has been increased over the years from 2012 to 2017 due to increase in sale price and dispatches.
              Current year Turnover significantly increased due to commissioning of Line II.


             80
            Cherat Cement
            Company Limited