Page 135 - CCL AR 2017 Final
P. 135

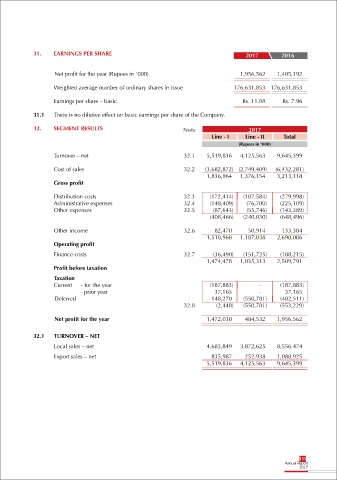
31.    EARNINGS PER SHARE                                                  2017        2016


                                                                                                       2014
                     Net profit for the year (Rupees in `000)                         1,956,562    1,405,192

                    Weighted average number of ordinary shares in issue            176,631,853  176,631,853

                    Earnings per share – basic                                        Rs. 11.08      Rs. 7.96
             31.1    There is no dilutive effect on basic earnings per share of the Company.


             32.    SEGMENT RESULTS                               Note                   2017
                                                                            Line - I    Line - II    Total
                                                                                     (Rupees in ‘000)

                    Turnover – net                                32.1    5,519,836   4,125,563    9,645,399

                    Cost of sales                                 32.2   (3,682,872)  (2,749,409)   (6,432,281)
                                                                          1,836,964   1,376,154    3,213,118
                    Gross profit

                    Distribution costs                            32.3     (172,414)   (107,584)    (279,998)
                    Administrative expenses                       32.4     (148,409)    (76,700)    (225,109)
                    Other expenses                                32.5      (87,643)    (55,746)    (143,389)
                                                                           (408,466)   (240,030)    (648,496)
                                                                                                       2014
                    Other income                                  32.6       82,470     50,914      133,384
                                                                          1,510,968   1,187,038    2,698,006
                    Operating profit

                    Finance costs                                 32.7      (36,490)   (151,725)    (188,215)
                                                                          1,474,478   1,035,313    2,509,791
                    Profit before taxation

                    Taxation
                     Current    - for the year                             (187,883)        -        (187,883)
                                      - prior year                           37,165         -        37,165
                     Deferred                                               148,270    (550,781)    (402,511)
                                                                  32.8       (2,448)   (550,781)    (553,229)

                    Net profit for the year                               1,472,030    484,532     1,956,562

             32.1    TURNOVER – NET

                    Local sales – net                                     4,683,849   3,872,625    8,556,474

                    Export sales – net                                      835,987    252,938     1,088,925
                                                                          5,519,836   4,125,563    9,645,399


                                                                                                           133
   130   131   132   133   134   135   136   137   138   139   140