
Page 56 - CCL AR 2017 Final
P. 56
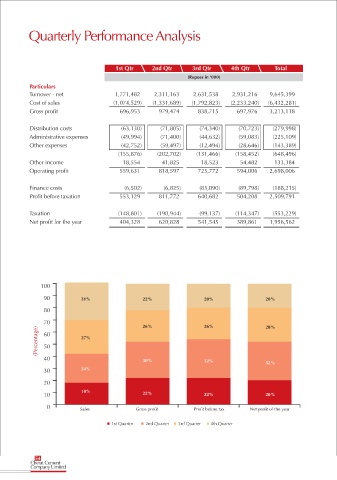
Quarterly Performance Analysis


                                          1st Qtr      2nd Qtr       3rd Qtr      4th Qtr         Total
                                                                   (Rupees in ‘000)
           Particulars
           Turnover - net                 1,771,482     2,311,163     2,631,538     2,931,216     9,645,399
           Cost of sales                 (1,074,529)    (1,331,689)    (1,792,823)    (2,233,240)    (6,432,281)
           Gross profit                     696,953      979,474       838,715       697,976     3,213,118

           Distribution costs               (63,130)      (71,805)      (74,340)      (70,723)    (279,998)
           Administrative expenses          (49,994)      (71,400)      (44,632)      (59,083)    (225,109)
           Other expenses                   (42,752)      (59,497)      (12,494)      (28,646)    (143,389)
                                           (155,876)     (202,702)     (131,466)    (158,452)     (648,496)
           Other income                      18,554        41,825       18,523        54,482      133,384
           Operating profit                 559,631      818,597       725,772       594,006     2,698,006

           Finance costs                     (6,502)       (6,825)      (85,090)      (89,798)    (188,215)
           Profit before taxation           553,129      811,772       640,682       504,208     2,509,791

           Taxation                        (148,801)     (190,944)      (99,137)    (114,347)     (553,229)
           Net profit for the year          404,328      620,828       541,545       389,861     1,956,562


               100

                90            31%                  22%                   20%                   20%

                80
                70                                 26%                   26%                   28%
              (Percentage)  60  27%


                50
                40                                 30%                   32%                   32%

                30            24%

                20
                              18%
                10                                 22%                   22%                   20%
                  0          Sales               Gross profit        Profit before tax   Net profit of the year


                                        1st Quarter   2nd Quarter   3rd Quarter   4th Quarter


             54
            Cherat Cement
            Company Limited