
Page 55 - CCL AR 2017 Final
P. 55
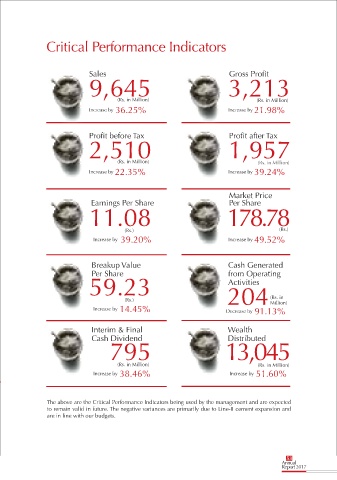
Critical Performance Indicators


                                Sales                                             Gross Profit
                                9,645                                             3,213


                                          (Rs. in Million)                                  (Rs. in Million)

                                Increase by  36.25%                               Increase by 21.98%


                                Profit before Tax                                 Profit after Tax
                                2,510                                             1,957


                                          (Rs. in Million)                                  (Rs. in Million)
                                Increase by  22.35%                               Increase by 39.24%


                                                                                  Market Price
                                 Earnings Per Share                               Per Share
                                11.08                                            178.78


                                             (Rs.)                                                 (Rs.)
                                  Increase by  39.20%                             Increase by 49.52%


                                 Breakup Value                                   Cash Generated
                                                                                 from Operating
                                 Per Share
                                59.23                                            Activities


                                             (Rs.)                               204            (Rs. in
                                                                                                Million)
                                  Increase by  14.45%                            Decrease by  91.13%


                                 Interim & Final                                 Wealth
                                 Cash Dividend                                   Distributed
                                        795                                     13,045


                                          (Rs. in Million)                                  (Rs. in Million)
                                  Increase by  38.46%                             Increase by 51.60%


                  The above are the Critical Performance Indicators being used by the management and are expected
                  to remain valid in future. The negative variances are primarily due to Line-II cement expansion and
                  are in line with our budgets.


                                                                                                      53
                                                                                                    Annual
                                                                                                    Report 2017