
Page 108 - CCL AR 2017 Final
P. 108
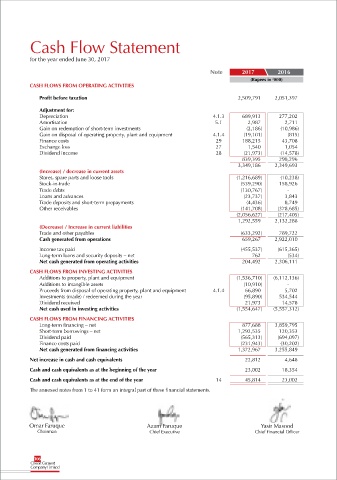
Cash Flow Statement


            for the year ended June 30, 2017

                                                                           Note       2017         2016
                                                                                         (Rupees in ‘000)
            CASH FLOWS FROM OPERATING ACTIVITIES

               Profit before taxation                                                2,509,791    2,051,397

               Adjustment for:
               Depreciation                                                 4.1.3     689,913      277,202
               Amortisation                                                  5.1        2,987        2,711
               Gain on redemption of short-term investments                             (2,186)     (10,986)
               Gain on disposal of operating property, plant and equipment   4.1.4     (19,101)       (815)
               Finance costs                                                 29       188,215       43,708
               Exchange loss                                                 27         1,540        1,054
               Dividend income                                               28        (21,973)     (14,578)
                                                                                      839,395      298,296
                                                                                     3,349,186    2,349,693
               (Increase) / decrease in current assets
               Stores, spare parts and loose tools                                  (1,216,689)     (10,238)
               Stock-in-trade                                                         (539,290)    158,926
               Trade debts                                                            (130,767)           -
               Loans and advances                                                      (23,737)      3,843
               Trade deposits and short-term prepayments                                (4,436)      8,749
               Other receivables                                                      (141,708)    (378,685)
                                                                                    (2,056,627)    (217,405)
                                                                                     1,292,559    2,132,288
               (Decrease) / Increase in current liabilities
               Trade and other payables                                               (633,292)    789,722
               Cash generated from operations                                         659,267     2,922,010

               Income tax paid                                                        (455,537)    (615,365)
               Long-term loans and security deposits – net                                762         (534)
               Net cash generated from operating activities                           204,492     2,306,111

            CASH FLOWS FROM INVESTING ACTIVITIES
               Additions to property, plant and equipment                           (1,536,710)   (6,112,136)
               Additions to intangible assets                                          (10,910)           -
               Proceeds from disposal of operating property, plant and equipment   4.1.4   66,890    5,702
               Investments (made) / redeemed during the year                           (95,890)    534,544
               Dividend received                                                       21,973       14,578
               Net cash used in investing activities                                (1,554,647)   (5,557,312)

            CASH FLOWS FROM FINANCING ACTIVITIES
               Long-term financing – net                                              877,688     3,859,795
               Short-term borrowings – net                                           1,292,535     120,353
               Dividend paid                                                          (565,313)    (694,097)
               Finance costs paid                                                     (231,943)     (30,202)
               Net cash generated from financing activities                          1,372,967    3,255,849

            Net increase in cash and cash equivalents                                  22,812        4,648

            Cash and cash equivalents as at the beginning of the year                  23,002       18,354

            Cash and cash equivalents as at the end of the year              14        45,814       23,002

            The annexed notes from 1 to 41 form an integral part of these financial statements.


           Omar Faruque                              Azam Faruque                            Yasir Masood
              Chairman                                Chief Executive                      Chief Financial Officer


             106